Observability in Event-Driven Microservice Architecture
Introduction
In recent years, event-driven microservice architecture has gained significant popularity among developers due to its ability to handle complex and scalable applications. However, as the number of microservices and events in the system increases, it becomes challenging to understand and debug the system behavior. This is where observability comes in.
Observability, in the context of event-driven microservice architecture, refers to the ability to understand the internal state of a system by analyzing its outputs or events. In this blog post, we will explore the concept of observability in event-driven microservice architecture and discuss practical strategies to achieve it effectively.
The Pillars of Observability
To ensure a system is observable, it is essential to focus on three key pillars:
Logging
Logging plays a vital role in capturing and storing relevant information about the events occurring within the system. It provides a historical view of the system’s behavior and can be invaluable when troubleshooting issues. When implementing logging in an event-driven microservice architecture, consider the following best practices:
- Use a structured logging format to enable easy searching and filtering of logs.
- Include pertinent details such as request IDs, event IDs, timestamps, and contextual information in the log entries.
- Centralize the logs using a log management solution, such as ELK stack or CloudWatch, for easier analysis.
Metrics
Metrics provide quantitative data about the performance and behavior of the system. They help identify bottlenecks, track trends, and provide insights into various aspects of the architecture. Consider the following when implementing metrics in your event-driven microservice architecture:
- Define meaningful and relevant metrics for each microservice, such as request latency, event throughput, and error rates.
- Use a time-series database, like Prometheus or InfluxDB, to store and visualize the metrics.
- Establish alerting mechanisms to notify team members about abnormal or critical metric values.
Tracing
Tracing allows you to follow the flow of events as they propagate through the microservices. It aids in troubleshooting and understanding the interactions between different components of the system. When implementing tracing in your event-driven microservice architecture, keep the following considerations in mind:
- Instrument your code to generate trace data, including timing information and event correlations.
- Utilize distributed tracing tools, such as Jaeger or Zipkin, to collect and analyze the trace data.
- Correlate traces with other observability data, like logs and metrics, to gain a holistic view of the system behavior.
Tools for Observability
To achieve observability in an event-driven microservice architecture, you need appropriate tools and platforms. Let’s explore some popular ones:
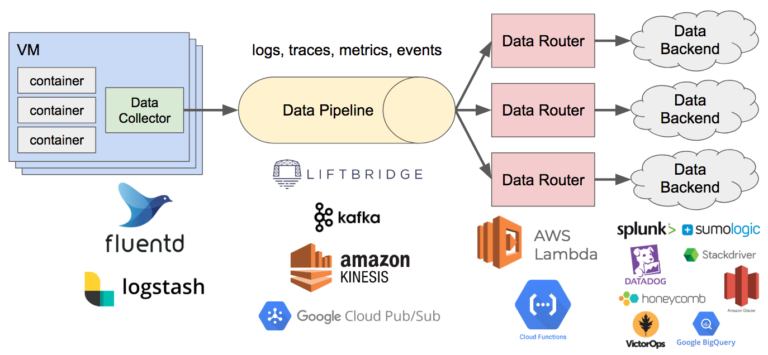
Apache Kafka
Apache Kafka is a distributed streaming platform that excels at processing and storing large volumes of incoming events. It provides features like event partitioning, replication, and fault-tolerance, making it an ideal choice for event-driven architectures. Kafka integrates seamlessly with logging, metrics, and tracing tools, enabling efficient observability.
ELK Stack
The ELK (Elasticsearch, Logstash, Kibana) stack is a widely adopted solution for log management and analysis. Elasticsearch stores and indexes logs, Logstash helps collect, transform, and filter logs, and Kibana offers a visual interface to search and visualize the logs. By integrating Kafka with the ELK stack, you can centralize and analyze logs effectively.
Prometheus
Prometheus is a powerful open-source monitoring system that specializes in metrics collection, storage, and alerting. It offers a flexible query language and a user-friendly UI for metric visualization. Prometheus can be integrated into your event-driven microservice architecture by implementing a Prometheus client library in each microservice.
Jaeger
Jaeger is an open-source distributed tracing system that helps monitor and troubleshoot complex microservice architectures. It supports various instrumentation libraries, allowing you to easily trace messages across different microservices. By integrating Jaeger with your event-driven microservice architecture, you can gain invaluable insights into the system’s behavior and performance.
Best Practices for Observability
Now that we have discussed the pillars of observability and some popular tools, let’s explore a set of best practices to ensure effective observability in your event-driven microservice architecture:
- Define a clear observability strategy: Determine what aspects of your system you want to observe and implement the necessary tools and processes accordingly.
- Utilize distributed tracing: Implement distributed tracing to gain visibility into the interactions between components and identify potential performance bottlenecks.
- Instrument your code effectively: Properly instrument your microservices to capture relevant metrics, logs, and traces at the appropriate stages of event propagation.
- Standardize logging and metric formats: Use standard formats like JSON or structured logging to enable easy searching, filtering, and analysis of logs and metrics.
- Implement automated monitoring and alerting: Set up automated monitoring and alerting mechanisms to detect anomalies, performance issues, and errors in real-time.
- Leverage visualization tools: Utilize tools like Kibana or Grafana to create dashboards and visualize logs, metrics, and traces.
- Adopt a canary deployment strategy: Deploy new changes gradually to monitor their impact on the system and catch potential issues early.
Real-World Examples
Let’s look at a few real-world examples of how observability has helped organizations improve their event-driven microservice architectures:
Example 1: Netflix
Netflix heavily relies on event-driven microservice architecture to power its streaming platform. They have successfully implemented observability at scale by leveraging tools like Apache Kafka, ELK stack, and Zipkin. By analyzing logs, metrics, and traces, Netflix can track system-wide performance, identify bottlenecks, and rapidly respond to issues.
Example 2: Uber
Uber’s event-driven microservice architecture generates massive volumes of events daily. To gain insights into their system’s behavior, Uber uses Apache Kafka, Elasticsearch, and Jaeger. By effectively monitoring and analyzing their event streams, Uber can ensure a seamless experience for both riders and drivers.
Conclusion
Observability is a crucial aspect of any event-driven microservice architecture. By implementing the pillars of observability – logging, metrics, and tracing – along with appropriate tools and best practices, you can gain deep insights into your system’s behavior and ensure its stability and performance. Remember, effective observability is an ongoing process that requires continuous improvement and adaptation to the evolving needs of your architecture.
Comments are closed.